AI In Business12 Best AI Reporting Tools for Automating Business Reports
The short answer
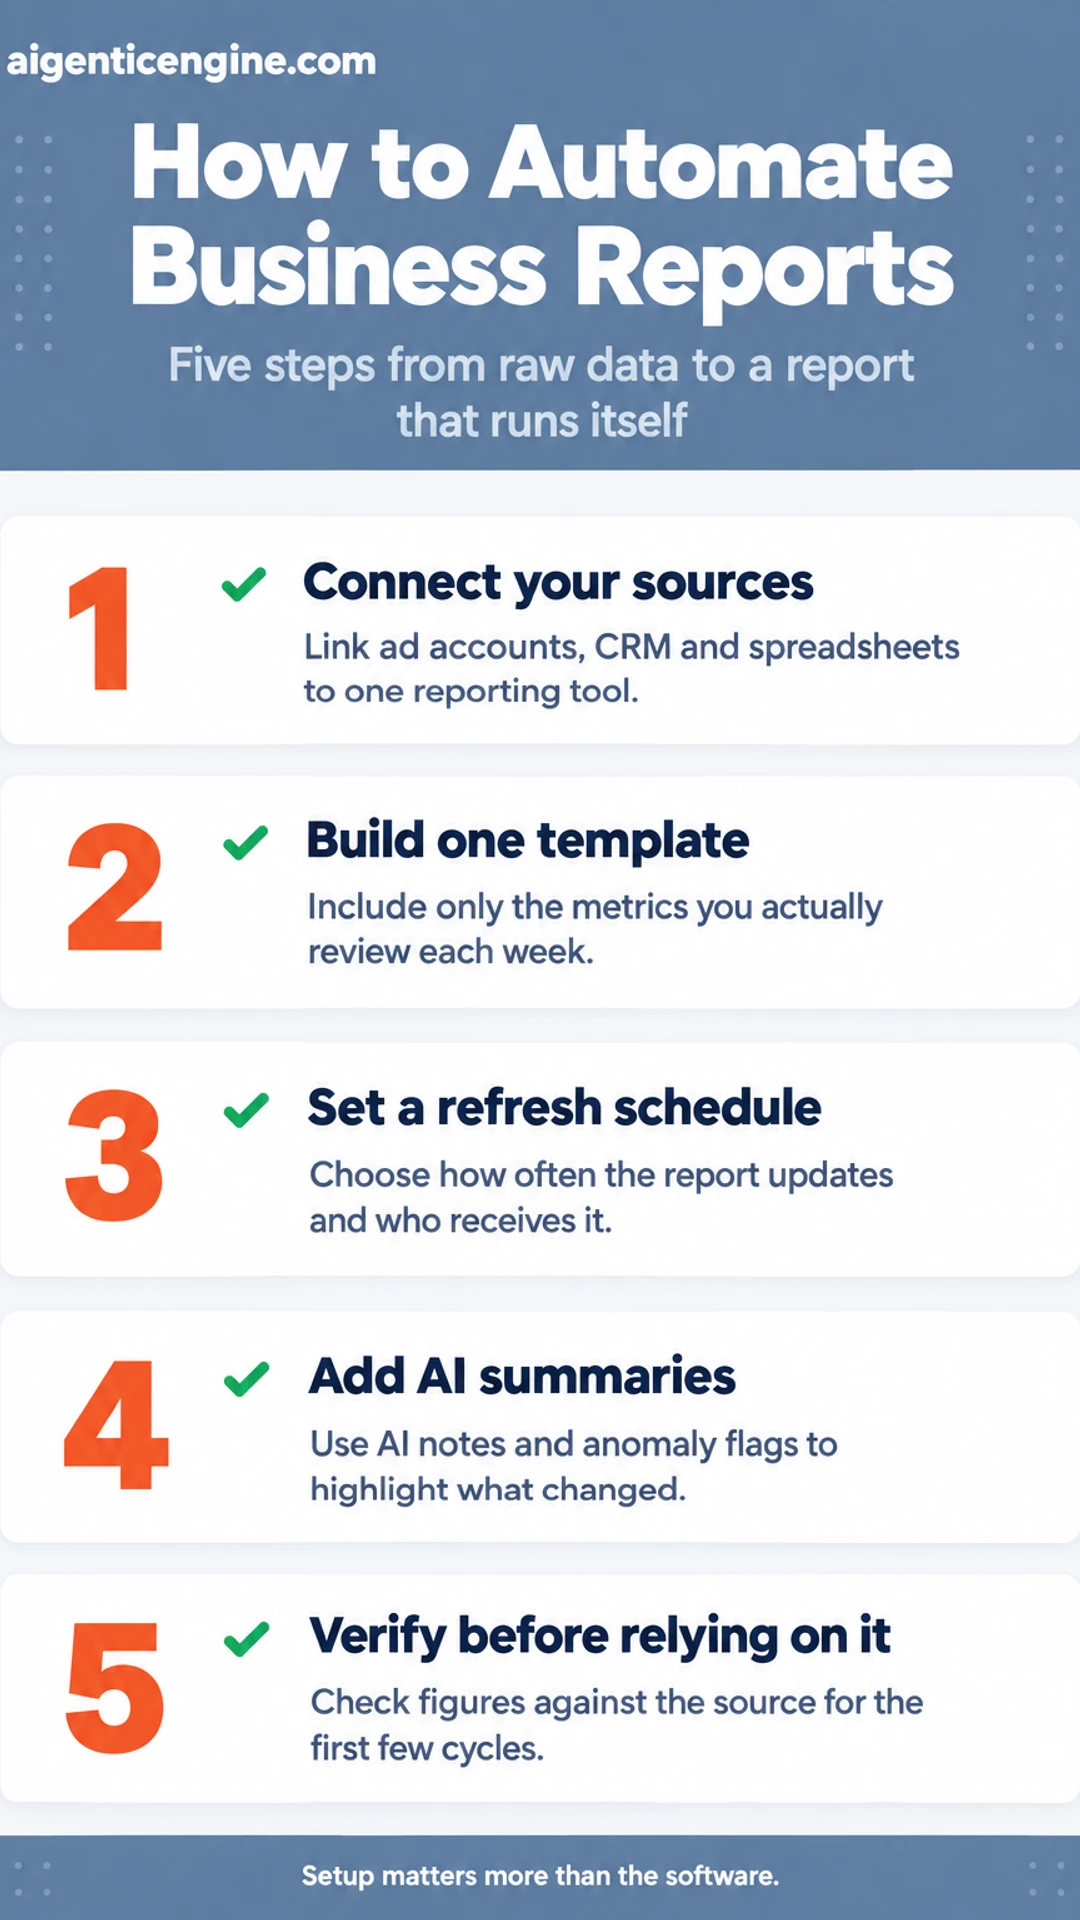
To automate business reports with AI, connect your data sources (ad accounts, CRM, spreadsheets) to a reporting tool, build one template with the metrics you actually review, set a refresh schedule, and add AI summaries or anomaly flags on top. Check the numbers against the source for the first few cycles before you rely on them.
Most of the work is in the setup, not the software. When you pick the right tool and wire it to the systems you already use, the weekly report stops being a Friday chore and arrives on its own.
This list covers 12 AI reporting tools that can automate business reports. Each entry was chosen for what it does well for owners, small teams and agencies: connectors, scheduling, and whether the AI features help you spot problems or simply decorate charts.
This guide is based on published specifications and what buyers report, not our own testing. Treat vendor claims as claims and verify them yourself.
Along the way, you will see how this fits into the rest of our AI in business hub, including our guides on how to start using AI in your business in 30 days and how AI can automate routine operations tasks.
Let's dive in.
The 12 tools at a glance
| Tool | Best for | Pricing noted in article |
|---|---|---|
| Looker Studio | Small teams on Google platforms | Free connectors |
| Improvado | Large marketing teams, many channels | Quote-based |
| Whatagraph | Marketing agencies with branded reports | Not stated |
| AgencyAnalytics | Agencies with client portals | Not stated |
| Supermetrics | Teams feeding Sheets or BI tools | Not stated |
| HubSpot reporting | Teams already in HubSpot CRM | Not stated |
| Funnel.io | Multi-channel campaigns needing clean data | Not stated |
| Polymer | Owners with single spreadsheet files | Not stated |
Hiring vs Automating Cost Calculator
AI in Business Calculator: Which Workflows to Automate First
A closer look at each
-
Looker Studio: A free Google tool for building dashboards that pull from Google Analytics, Google Ads, Search Console and Google Sheets. Its built-in connectors are free, so a small team can set up a live campaign report in an afternoon without paying for a reporting platform. Scheduled email delivery is available, though it suits simpler layouts than the paid options below.
-
Improvado: A data integration platform aimed at larger marketing teams that pull from many advertising, analytics and CRM sources at once. It maps and cleans that data into one model before reporting, which is why it suits companies running campaigns across a dozen channels. Pricing is quote-based, so expect a sales conversation rather than a published rate card.
-
Whatagraph: A reporting tool built for marketing agencies that need polished, branded reports for each client. Templates, white-label output and automated scheduled sends cut the hours spent copying charts into slides. Check which data connectors your current clients use before committing, since coverage varies by platform.
-
AgencyAnalytics: Agency reporting software that combines client dashboards, automated reports and a white-label client portal in one place. Clients can log in to check campaign performance any time, which often reduces the number of "how is my campaign doing?" emails an account manager receives each week. Confirm the plan includes the integrations you rely on.
-
Supermetrics: A data connector rather than a full dashboard tool, designed to move marketing and sales data into Google Sheets, Excel, Looker Studio or a data warehouse. It is a good fit when your team already has spreadsheet or BI habits and mainly needs clean, refreshed data delivered on a schedule. It does not replace the visual layer, so budget for whatever tool displays the results.
-
HubSpot reporting: Built-in reporting inside HubSpot CRM, covering deal pipeline, lead sources, email performance and campaign results. Because the data already sits in the CRM, there is no connector to maintain and no sync to break. Its limits show up when you need to combine HubSpot data with ad platform or finance data, which usually means adding an outside tool.
-
Funnel.io: Funnel.io pulls data from advertising platforms, analytics tools and CRMs into one place, then cleans and standardizes it before any report is built. Its published materials describe connectors for many common marketing sources, so a team running a campaign across several channels can reconcile naming and currency issues upstream. Clean inputs are what keep automated reports from carrying errors forward.
-
Polymer: Polymer lets you upload a spreadsheet or CSV file and produce visual dashboards with little setup, which suits an owner who already keeps records in Excel or Google Sheets. Its vendor materials emphasize drag-and-drop charts and sharing links. It works best for one-off or periodic reports from a single file, rather than live feeds across many systems.
-
Zapier-based workflows: This is the do-it-yourself route, where you connect your own tools with Zapier and have it move information, such as new form entries or closed deals, into a spreadsheet that feeds a report. Zapier's published pricing is tiered by task volume, so check current plans before committing. You trade convenience for control, and you own every connection you build.
-
Scheduled AI summary tools: These products read a report's figures on a schedule and write a plain-language note describing what changed, such as "spend rose while conversions fell." Vendors often describe this as saving reading time for busy owners. A summary is only as reliable as the numbers beneath it, so confirm the underlying data before acting on the narrative.
-
Choosing by business stage: A solo owner with one sales channel usually needs a spreadsheet plus a simple visual tool like Polymer. A growing team with several platforms benefits from a connector tool like Funnel.io. Agencies managing many client accounts should prioritize tools that handle multiple workspaces and permissions, and a Zapier build suits owners with some technical comfort.
-
What to check before you trust a report: Before acting on any automated report, confirm the date range, compare one total against its source platform, check that currency and time zones match, and look for duplicate or missing rows. Ask who maintains each connection and how failures are flagged. A report that skips these checks can look polished while quietly misstating performance.
Frequently asked questions
Can AI really write a business report without someone checking it?
Not safely, at least not yet for anything that goes to a client, lender or board. AI reporting tools are good at pulling figures, building charts and drafting summaries, but they can misread a column or mislabel a category. Treat the output as a strong first draft and check the totals and any figure that drives a decision before it leaves your desk.
What data do I need before I can automate a business report with AI?
You need a source the tool can reach and a consistent structure. That usually means exports or live connections from your accounting software, CRM, ad platforms or spreadsheets, plus clear column names and date ranges. If the same metric is named three different ways across systems, fix that first. Clean, consistent inputs matter more than which tool you choose.
How long does it take to set up an automated AI report?
For a simple weekly sales or marketing summary connected to one or two sources, a first version often takes an afternoon to a few days, mostly spent on connections and defining the metrics. More complex reports with multiple sources, custom formulas or approval steps can take several weeks. Expect the first month to involve some tuning as you refine what the report needs to say.
Are AI reporting tools secure enough for sensitive financial data?
It depends on the vendor and your settings. Check whether the tool encrypts data in transit and at rest, whether it offers role-based access, and whether it states that your data is not used to train shared models. Review the vendor's published security documentation and ask your accountant or IT contact to look at it before you connect payroll or banking data.
Will automating reports with AI replace the person who builds them?
In most small businesses it changes the job rather than removing it. The routine work of gathering exports, formatting tables and drafting first-pass commentary shrinks, while the person still decides which numbers matter, questions anomalies and explains what to do next. Plan for that shift so the time saved goes toward analysis rather than simply disappearing.
Wrapping up
We covered 12 options for automating business reports with AI, each suited to a different kind of team and data setup.
The right choice depends on where your numbers live and who needs to read them.
Before you commit, check the data connections, the security terms and the true cost at your volume.
Which of the 12 are you going to try first, and did we leave out a tool you rely on?
Share this: X · LinkedIn · Facebook
Summarize with AI: ChatGPT · Claude · Perplexity